Sometimes there is a need to perform some debugging of an application that runs in a remote JVM. Java provides Java Debug Wire Protocol (JDWP) for the purpose and the debugging can be run in an IDE like Eclipse and NetBeans.
This guide may as well be applied to any other Java software. Here we will use Tomcat and a JSP file. Whenever possible debug software locally as it is much much faster.
Switch your Java to debug mode
This will require logging via SSH and modifying JAVA_OPTS in ~/.bashrc by appending
-Xdebug -Xrunjdwp:transport=dt_socket,address=8000,server=y,suspend=nto the JAVA_OPTS variable. The port 8000 needs to be replaced by one of unused ports from your Java Control Panel - Ports list. We use 10996 in this example. Then source the newly-modified .bashrc with:
source ~/.bashrcand restart Java (if on a shared server) with:
jrNow we can verify our Java process is listening on port 10996 with lsof -i. See an example:
[email protected] [~]# lsof -i
COMMAND PID USER FD TYPE DEVICE SIZE/OFF NODE NAME
java 756078 tomcat 4u IPv4 54465593 0t0 TCP *:10996 (LISTEN)
...
Connect to remote Java from Eclipse (Kepler in this example)
You need to have the sources of the project you run remotely.
Choose your project in Eclipse Package Explorer.
Set breakpoints in your code.
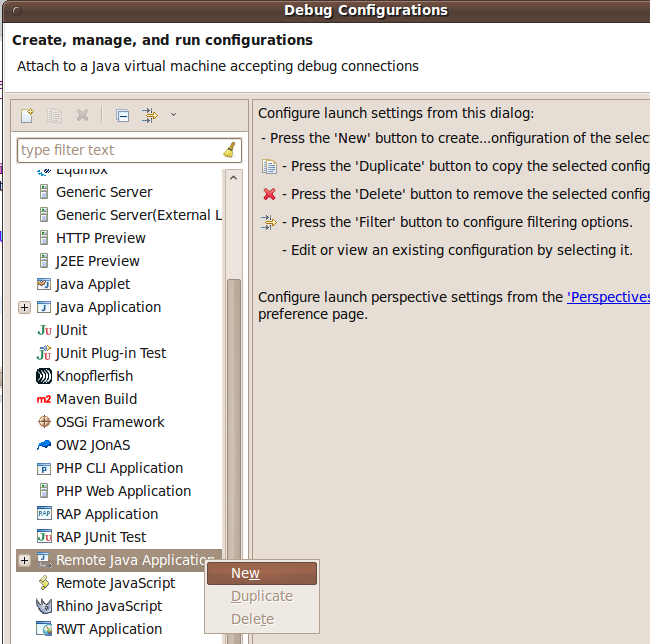
Click Run - Debug Configurations.
Choose Remote Java Application and then New from context menu (right mouse click).
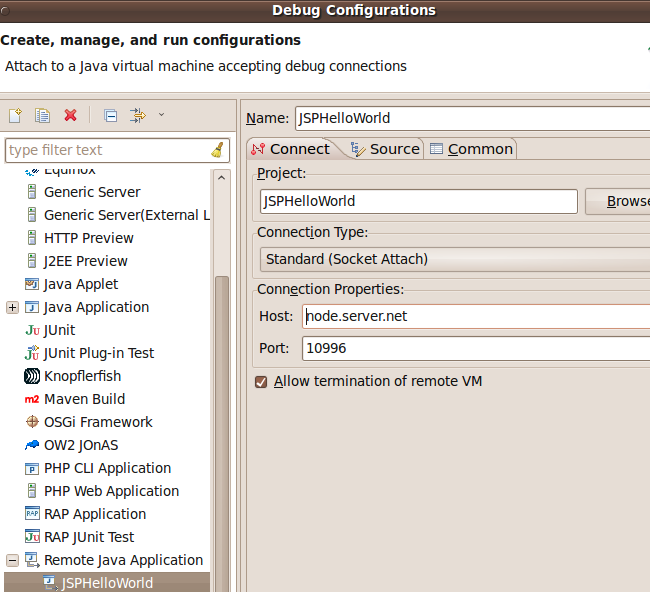
Set the server hostname and the port used in step #1. Optionally mark the Allow termination of remote VM check box if you want to be able to shutdown Java application (including Tomcat) from Eclipse.
Click Apply then Debug.
In the right bottom corner you will see notification about application being launched.
After it finishes lanuching, access your application online with a browser and you will be optionally prompted to switch perspective to Debug in Eclipse.
You now see how JVM starts and reaches index.jsp (in our example) line where first breakpoint is set. You may then step over breakpoints with F6. In Variables window you will see how variable a changes its value.
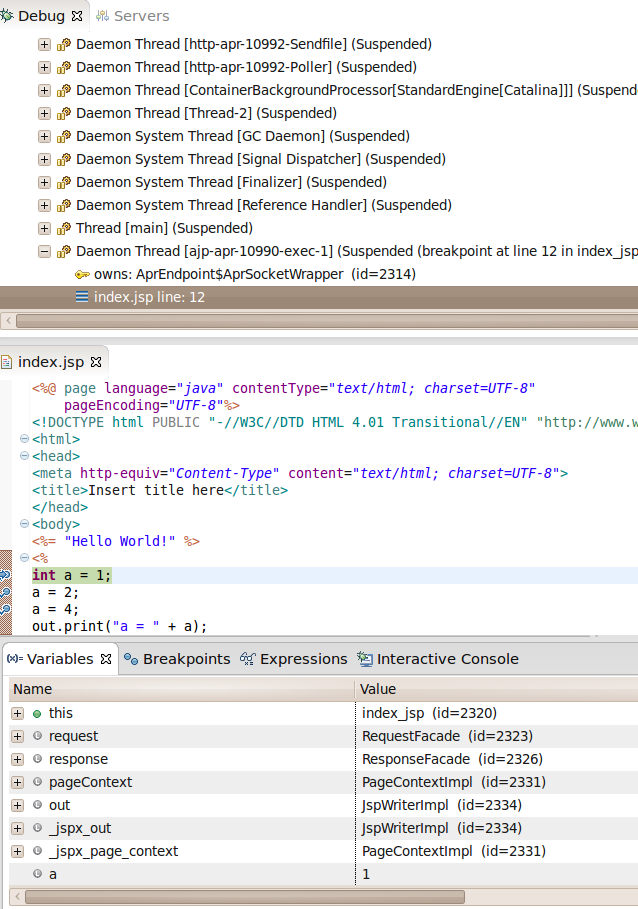
After last breakpoint you may need to press Resume (F8) to have final output shown in the browser. If you did not allow the process to finish its job in a reasonable time the browser will eventually report a time-out.
Frequently Asked Questions
Q: What port can I use?
A: If you are on a VPS just use the default 8000 (make sure it is open in firewall for incoming TCP connections). If you are on a shared server use one of the ports listed in Java Control Panel - Ports. For example most of Tomcat installs are not using port labelled OPENEJB_ADMIN so you can use this one. You can also request from us assigning you another port for the purpose.
Q: What does suspend=n mean?
A: It tells Java to not wait with running until debugger (Eclipse) connects. suspend=y makes more sense for standalone jar application that you want to debug from the very beginning. When debugging a web application running on an application server usually ‘suspend=n’ is more suitable.
Q: How do I increase debug verbosity?
A: Compile your code with -g debug switch. Default compilation settings only include line numbers and source file information.
Q: How do I upgrade my Eclipse Galileo to Kepler in Ubuntu 10.04?
A: The generic procedure for Ubuntu works here:
- Stop Eclipse and remove existing eclipse directory
rm -rf /usr/lib/eclipse
- download and unpack Kepler for example
tar xzf eclipse-standard-kepler-SR2-linux-gtk-x86_64.tar.gz - move unpacked ‘eclipse’ directory into /usr/lib
mv eclipse /usr/lib
- Edit /usr/bin/eclipse and replace [Gg]alileo with [Kk]epler
- Launch Eclipse and run Help - Check for Updates